1 Origins and statistics
1.1 WHAT IS A CLO?
The structure of a CLO (Collateralized Loan Obligation) is similar to a company's balance sheet with the difference that only one portfolio is managed within a Special Purpose Vehicle. CLOs have been issued since the early 1990s.
The asset side contains a pool of debt, often comprising of lower rated corporate loans. The portfolio is managed by a team of experienced credit specialists who are usually divided into industry groups and analyse the development of various corporations within their universe of industries. The result of the analysis is the asset allocation (purchase of loans) or the sale of riskier loans. The loan diversification in various industry groups results in a lower correlation with other market risks (please refer to
4. Correlations and Decorrelations).
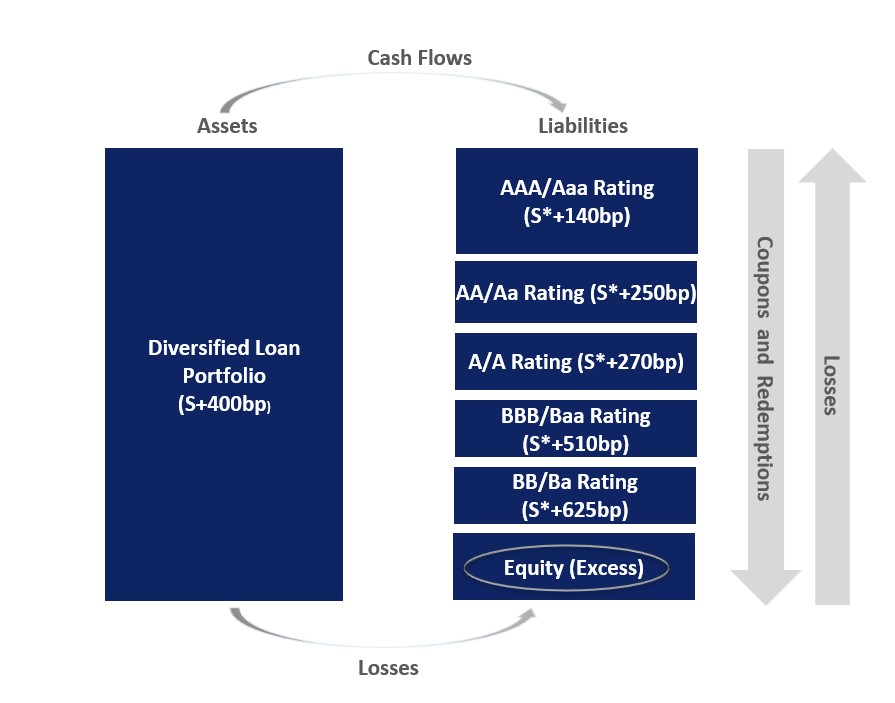
The liability side of the balance sheet is structured into tranches rated AAA to the lowest rated tranche BB or even B. The equity of the SPV is unrated. Earnings from the portfolio are distributed according to the waterfall principle, meaning interest and principal are first distributed to the most senior tranche (AAA), thereafter to the tranches below, giving priority according to the rating. For all rated tranches the coupon rate is fixed at issuance till the end of the non-call period. After serving interest and / or principal the remaining cash flow is distributed to the equity tranche. Since the equity tranche is the unrated first loss piece and hence carries the highest risk, it may receive a higher return (subject to CLO manager quality / Alpha).
The CLO asset side contains loans rated BB+ or lower, whereas up to 70% of the CLO liability side consists of an AAA component. This loan arbitrage is the reason for a cost-effective portfolio funding.
Graphical Representation of a Special Purpose Vehicle - the CLO
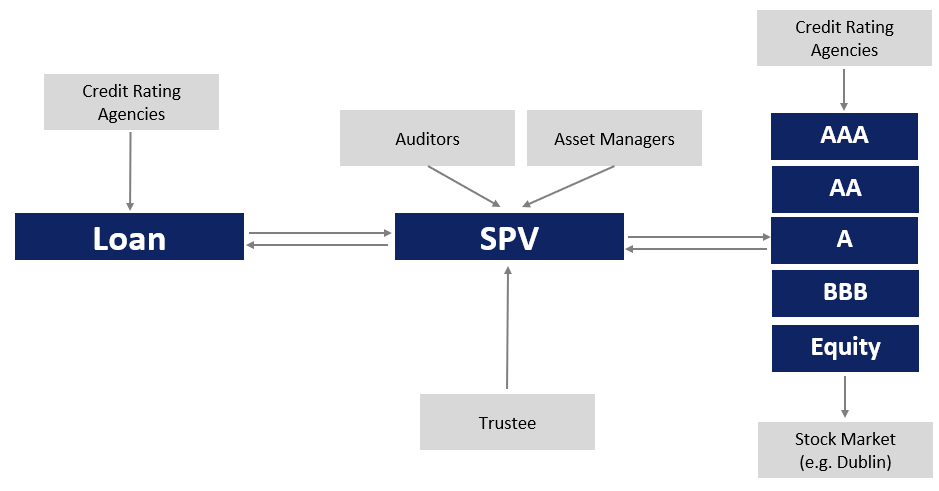
Diagram for illustration purpose only
Source: CIS
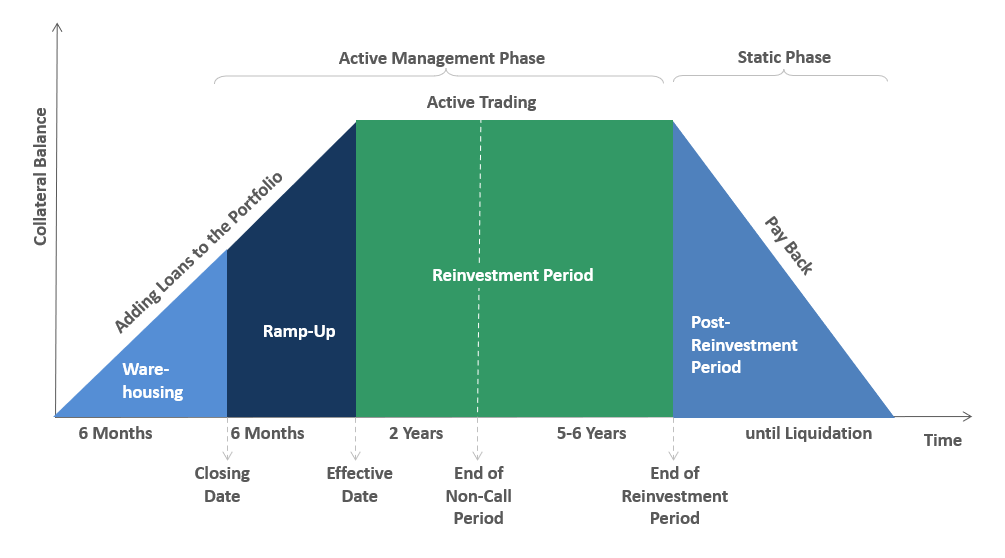
The liabilities of a CLO have a longer maturity than the asset side; therefore, the manager has to reinvest in order to match the maturity profiles. There is a pre-set reinvestment period, hereafter prepayments and maturing loans will be used to pay down the liabilities.
Assets as well as liabilities are generally both priced at a spread over a reference rate. Hence, the structure has a respectively low interest rate risk.
1.2 CONSTRUCTION AND LEGAL BASIS
Establishing a CLO
• Prior to establishing a CLO, an investment bank starts to purchase and "warehouse" loans (under the CLO mangers guidance). When the CLO is issued there is already a carefully selected portfolio of loans in place - ready to be purchased by the CLO manager. If the portfolio purchased does not cover 100% of the investment amount, the CLO manager continues to acquire loans directly in the market.
• Simultaneously, the investment bank markets the liabilities (please refer to
1.1 What is a CLO?) to institutional qualified investors. At pricing, the exact sizes of the tranches as well as their spreads are fixed. At settlement (closing date) the rated tranches and the equity tranche are paid for by the investors. The proceeds are used to purchase the portfolio for the SPV and to create the asset base / collateral of the CLO.
Legal basis of a CLO
• A CLO is incorporated within a Special Purpose Vehicle. It has a certificate of incorporation, memorandum and articles and most importantly the private placement memorandum (PPM). This issuing document is the basis to fund the asset side of the CLO structure. After settling the liabilities and the equity to purchase and transfer the portfolio to the CLO, the SPV functions like a normal company. The issuing document also defines the rating methodology for the individual tranches, the duties of the trustee, the flexibility of the CLO manager after the reinvestment period, the length of the reinvestment period, the auditor as well as the rights of the funding tranches.
• Issuing documents are unique, due to timing, market environment, choice of lawyers as well as investor demand.
CLO Life Cycle
Diagram for illustration purpose only
Source: CIS
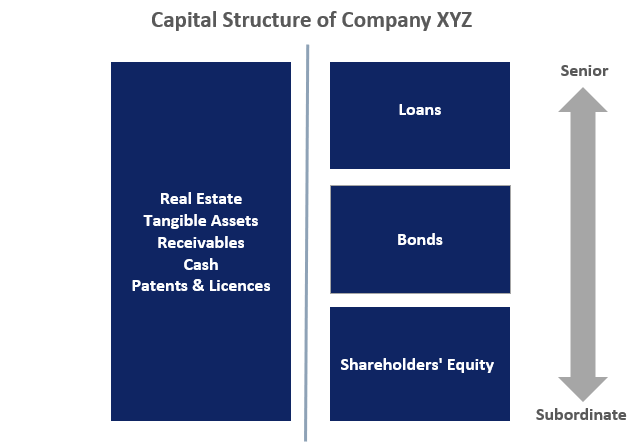
1.3 SENIORITY OF A LOAN
A senior loan holder has a legal claim to the borrower's assets above all other debt obligations. The loan is considered senior to all other claims against the borrower. In the event of bankruptcy, the senior loan is the first to be repaid prior all other parties.
In order to properly understand the seniority of loans, a look at the capital structure of a company is helpful:
Diagram for illustration purpose only
Source: CIS
1.4 THE DIFFERENCE BETWEEN LOANS AND BONDS
Seniority
• Senior secured loans are issued as first lien or second lien loans. They rank senior in the capital structure to unsecured debt and equity capital.
• Covenants provide additional protection for instance by setting limits on leverage and interest coverage ratios.
Default and Recovery Rates
Default rates of senior secured loans were historically on average 1.2%, compared to 3.42% of high yield bonds. *
Recovery rates of senior secured loans account historically for 62%, compared to 40% of high yield bonds. *
Maturity
• The legal final maturity of senior secured loans is usually around 5 to 7 years.
• Prepayments reduce the average maturity to around 2 to 3 years.
Coupon
• Coupons of senior secured loans are usually floating based on a reference rate, with or without cap or floor.
• Senior secured loans have low sensitivity to changes in interest rates (low interest rate duration), but high sensitivity to widening or tightening loan spreads (high loan spread duration).
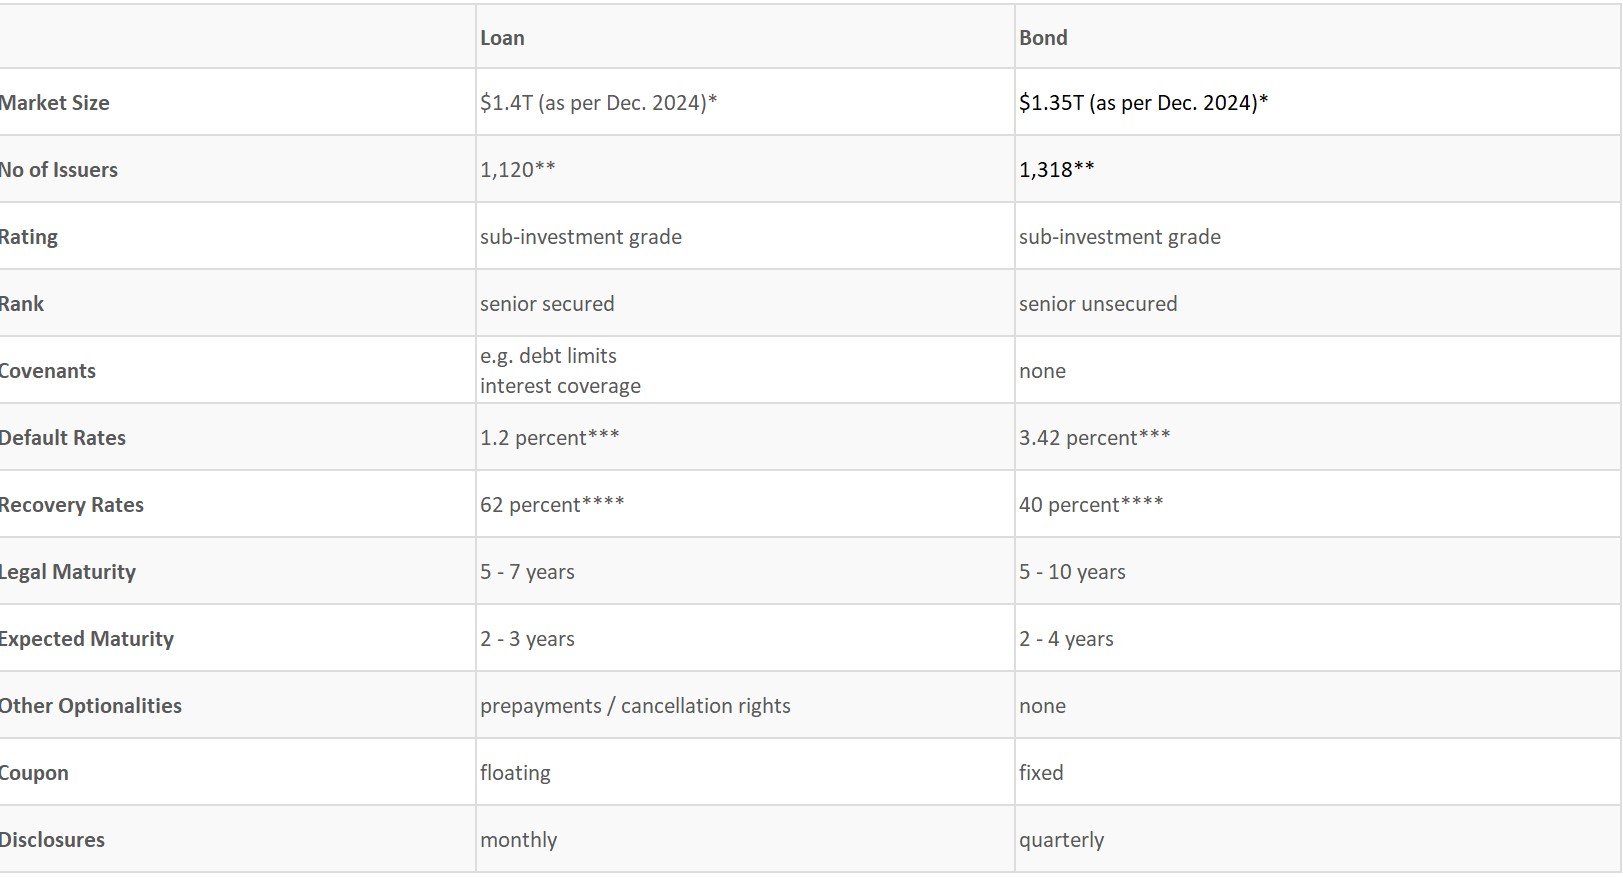
Table for Illustration purpose only
*Source: PitchBook; LCD
**Source: BofA Research
***Source: Pitchbook, Moody's, LCD, Morgan Stanley Research (excluding distressed exchanges for loans); T12M as of March 2025
****Source: Moody's, Morgan Stanley Research
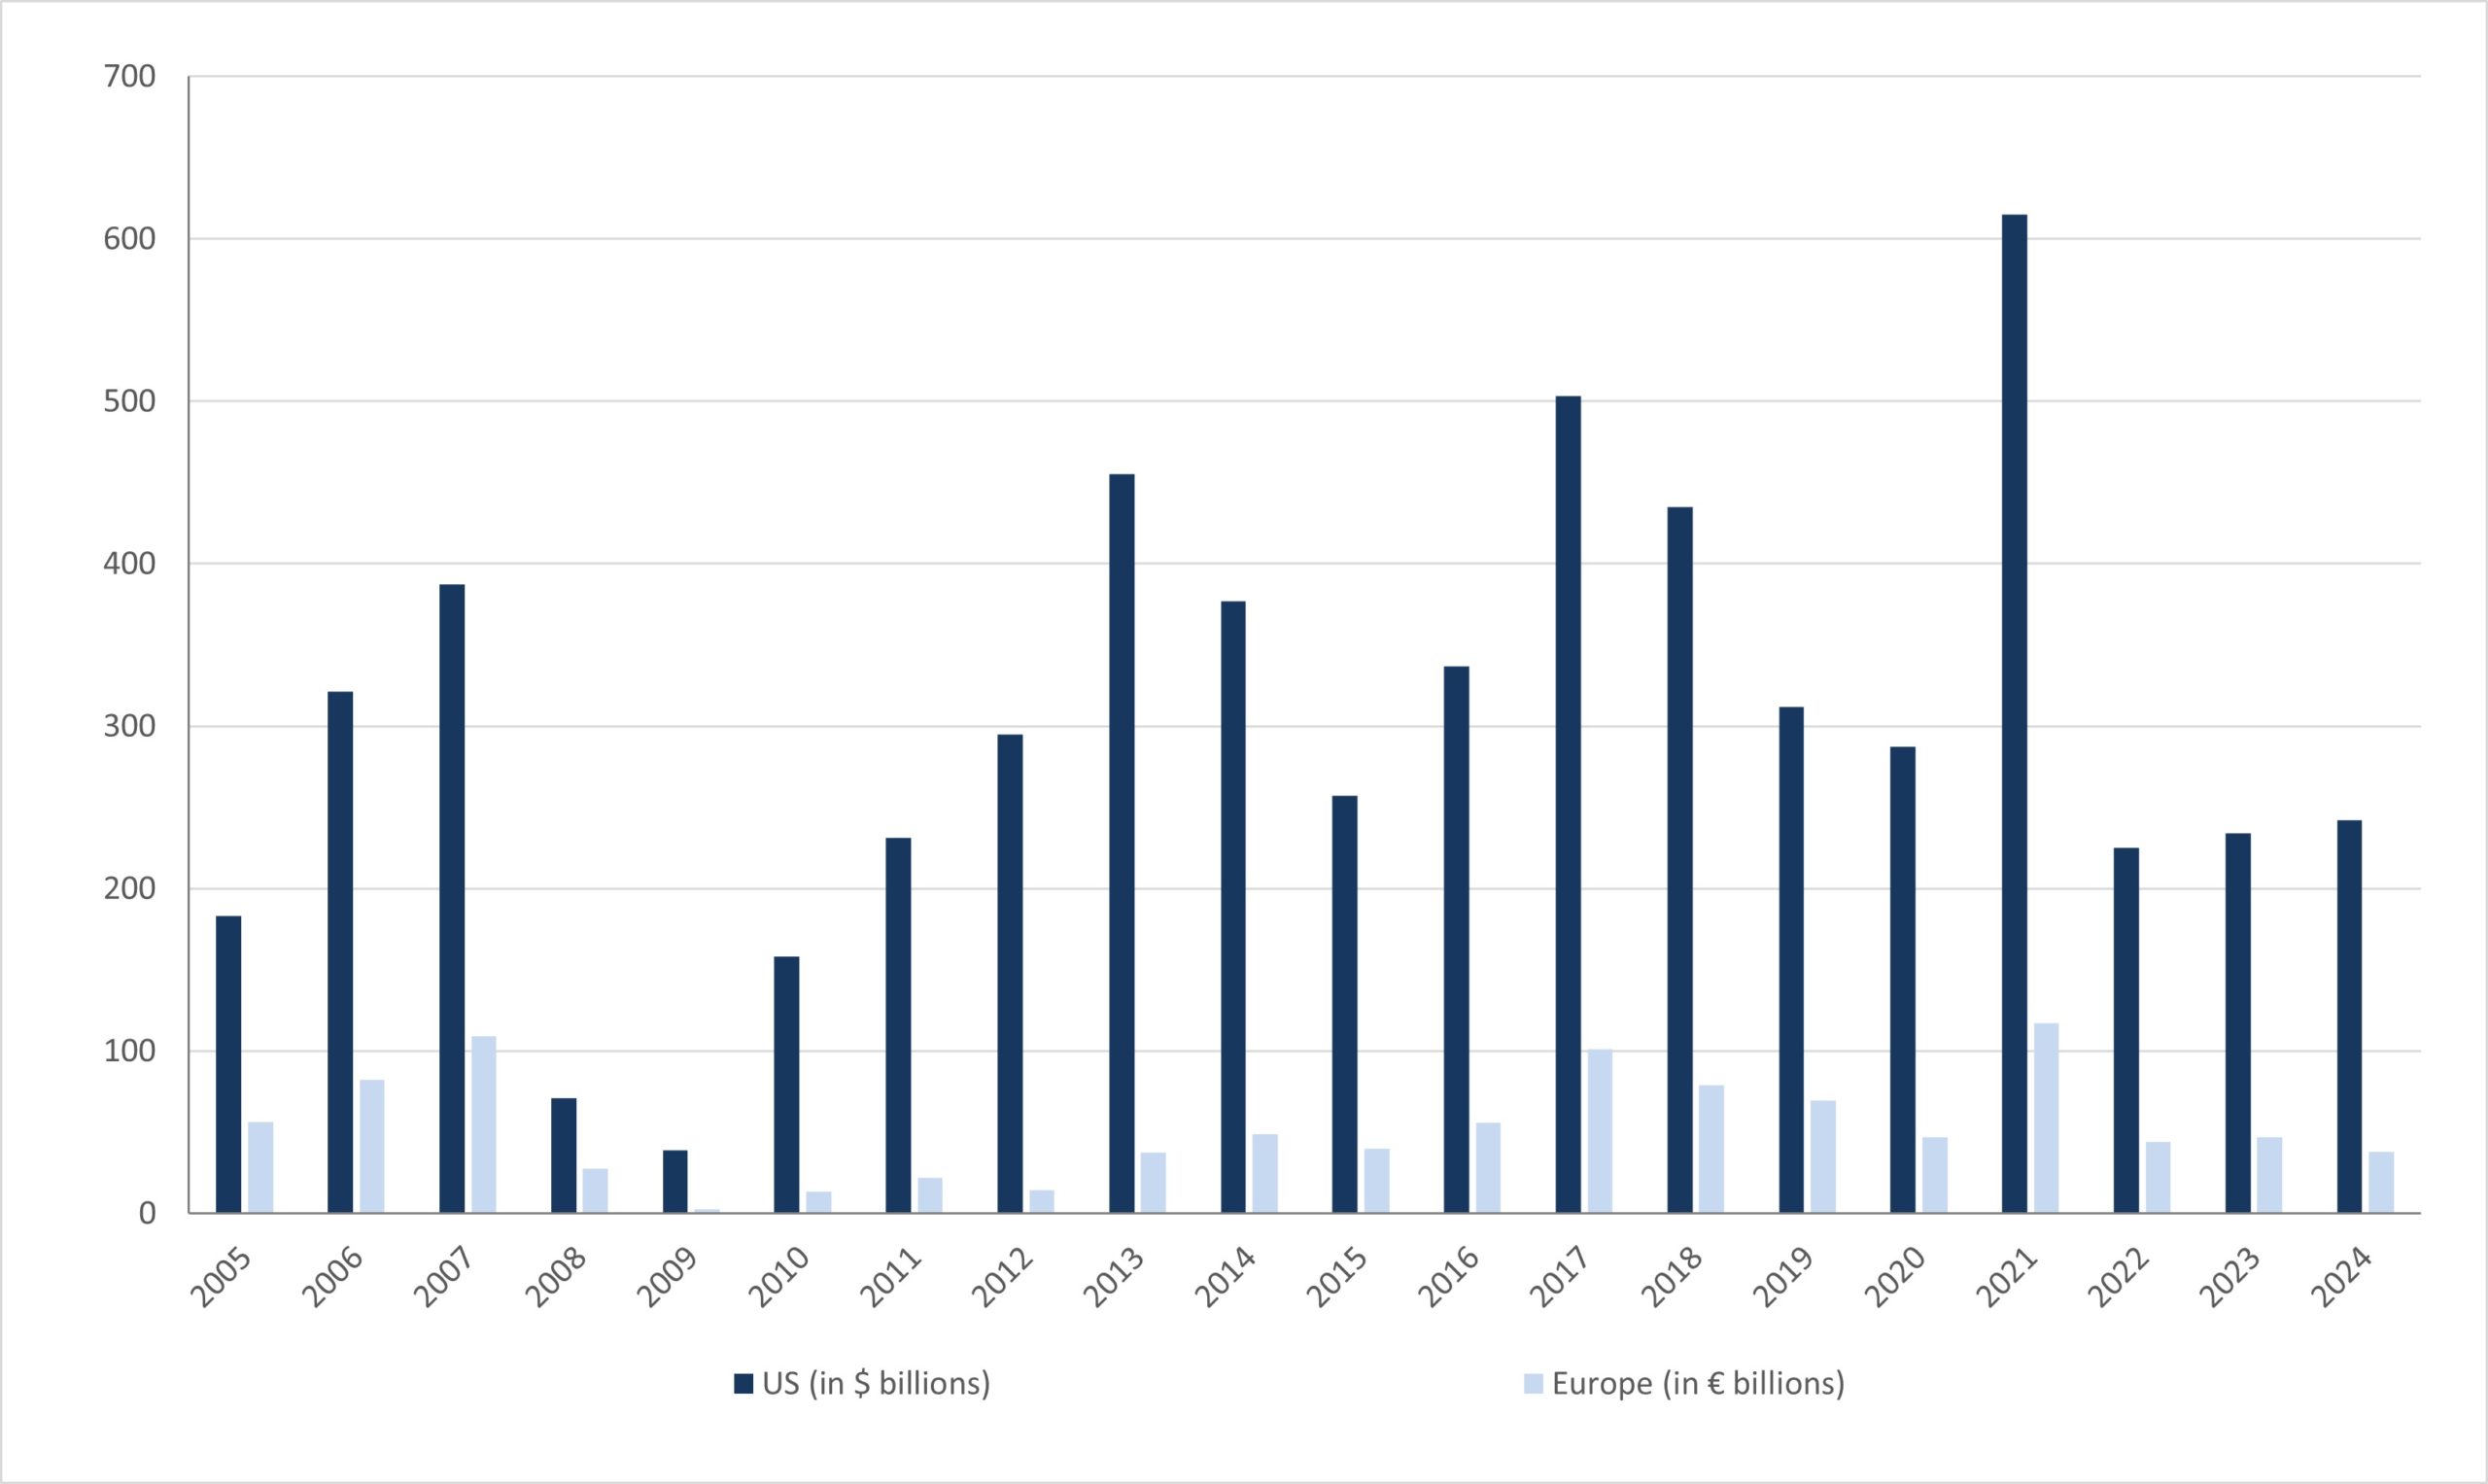
1.5 LOAN MARKET VOLUME (US VS. EUROPE)
Source: Pitchbook | LCD; data as per December 31, 2024
Market Depth
The institutional loan universe is more advanced in the US than in Europe. Considering the institutional loan issuance from 2010 to 2024, the loan issuance in the US accounts for $4,963 bn versus €773 bn in Europe.
Bankruptcy Code
• In the US, there is a uniform bankruptcy code ("Chapter 11") across all 50 states.
• In Europe, there is currently no uniform bankruptcy code across 47 countries.
Diversification
• Comparing the number of debtors on an industry category basis, the categories with the least numbers in the US contain 15 debtors vs. 2 debtors in Europe.
• On average, industry categories in the US contain 83 debtors versus 29 debtors in Europe.
The US leveraged loan universe is the least volatile and for this reason used for CLOs.
Source: S&P, ICE BofA, Morningstar
2 How a CLO works
2 How a CLO works
2.1 MANAGEMENT OF A CLO
The purpose of a CLO is to create returns using a sub-investment grade mostly senior secured corporate loan portfolio to satisfy return demands of risk-taking investors as well as being able to structure a CLO in a manner that most tranches sold to investors will carry an investment grade rating.
After purchasing the portfolio from the investment bank, it will be actively managed under a strict set of criteria which are defined at the issuance of the CLO. Prepayments will be reinvested, defaults will be restructured or liquidated until a recovery is paid and distressed loans will be sold and replaced.
The active management of the loan portfolio is terminated at the end of the reinvestment period. Thereafter, the flexibility of management may be reduced to monitor and sell loans but usually not reinvest loans due and prepayments.
The trustee provides monthly reporting for all investors outlining details of the portfolio and all statistics and covenants needed to maintain rating for the liabilities.
2.2 THE CLO AFTER THE REINVESTMENT PERIOD
After the reinvestment period (usually 4 to 5 years after origination) prepayments as well as loans due will not be reinvested. Funds available will be used to pay down the liability structure of the SPV, starting with the most senior tranche followed by the mezzanine tranches in the order of rating seniority. Subject to market conditions, the CLO manager may at any time after the reinvestment period with the consent of the senior tranche (if it is still outstanding) and the equity call the transaction, meaning all assets will be auctioned, the liabilities will be paid down and the SPV will be closed if all assets are liquidated. The last tranche receiving payments is the equity of the SPV.
*S ≙ Base Rates | 100 Basispoints (bp) = 1%
Diagram for illustration purpose only
Source: CIS
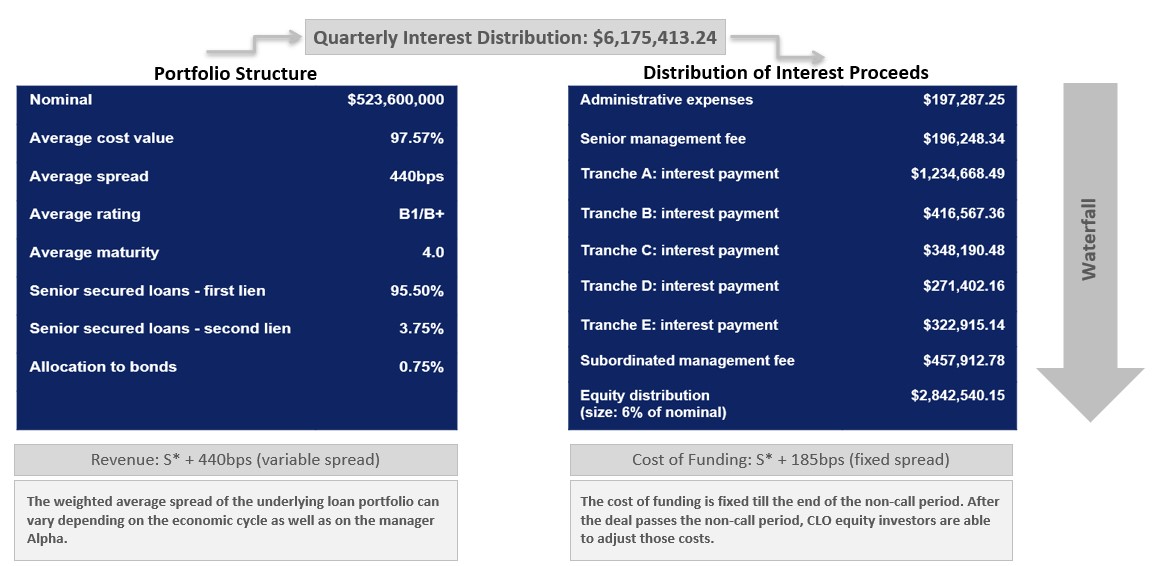
2.3 WATERFALL PRINCIPLE
In the world of securitization, the waterfall principle describes the subordination nature of various funding tranches according to their rating-based seniority. Payments of interest and principal will first serve the most senior rated tranche (AAA). After completely serving the most senior tranche, the next subordinated tranche (AA) will receive payments and so on. This approach is used all the way down to the unrated tranche, the CLO equity tranche.
Losses are allocated using the reverse waterfall principle whereas interest and capital losses are first absorbed by the lowest tranche or first loss piece (equity) until this tranche is completely absorbed, followed by the more senior tranches above (B, BB, BBB).
Example of the Waterfall Principle for a Quarterly Interest Distribution
*S ≙ Base Rates | 100 Basispoints (bp) = 1%
Diagram for illustration purpose only
Source: CIS
2.4 THE ROLE OF THE CLO MANAGER
CLOs by nature are Asset Backed Securities (ABS). The asset side of ABS structures are generally a pool of claims. Due to the large size and high diversification the pools tend to be static. For this reason, the lowest rated or unrated tranche will not carry any Alpha component and may only perform due to good selection or timing of the pool. In this respect CLOs are different because the portfolio of senior secured loans is actively managed and carry for this reason a (sometimes significant) Alpha component. The difference of CLOs issued in the same year under similar market conditions with the same reinvestment period may be very large.
2.1 Management of a CLO) and carry significant alpha components because of management performance. The difference between an above-average and a below-average CLO, emmitted in the same year, with the same reinvestment period, can be significant.
Hence, manager skills are an important factor when selecting a CLO to invest in. The following considerations are listed as an exemplary basis to get a better understanding on potential areas to look at when comparing and analysing different CLO managers:
• Existing track record lasting over various economic and credit cycles;
• Focus and specialization on industry groups and regions (know-how and value drivers);
• Team structure and processes as well as focus on key personnel;
• Loan selection and investment process (relative value strategies / loan spreads);
• Historical default rates, diversification and quality of covenants;
• Interest and cash flow development within the CLOs under management;
• Risk and liquidity management, risk structure (economic cycles);
• Timing, portfolio construction and management (position in economic and credit cycle);
• Successful investment of prepayments;
• Is the CLO manager invested in the CLO (alignment of interest)?
• Checking covenant clauses as well as the CLO's ability to empower its rights;
• Average experience of the individual, the team and turnover within the team;
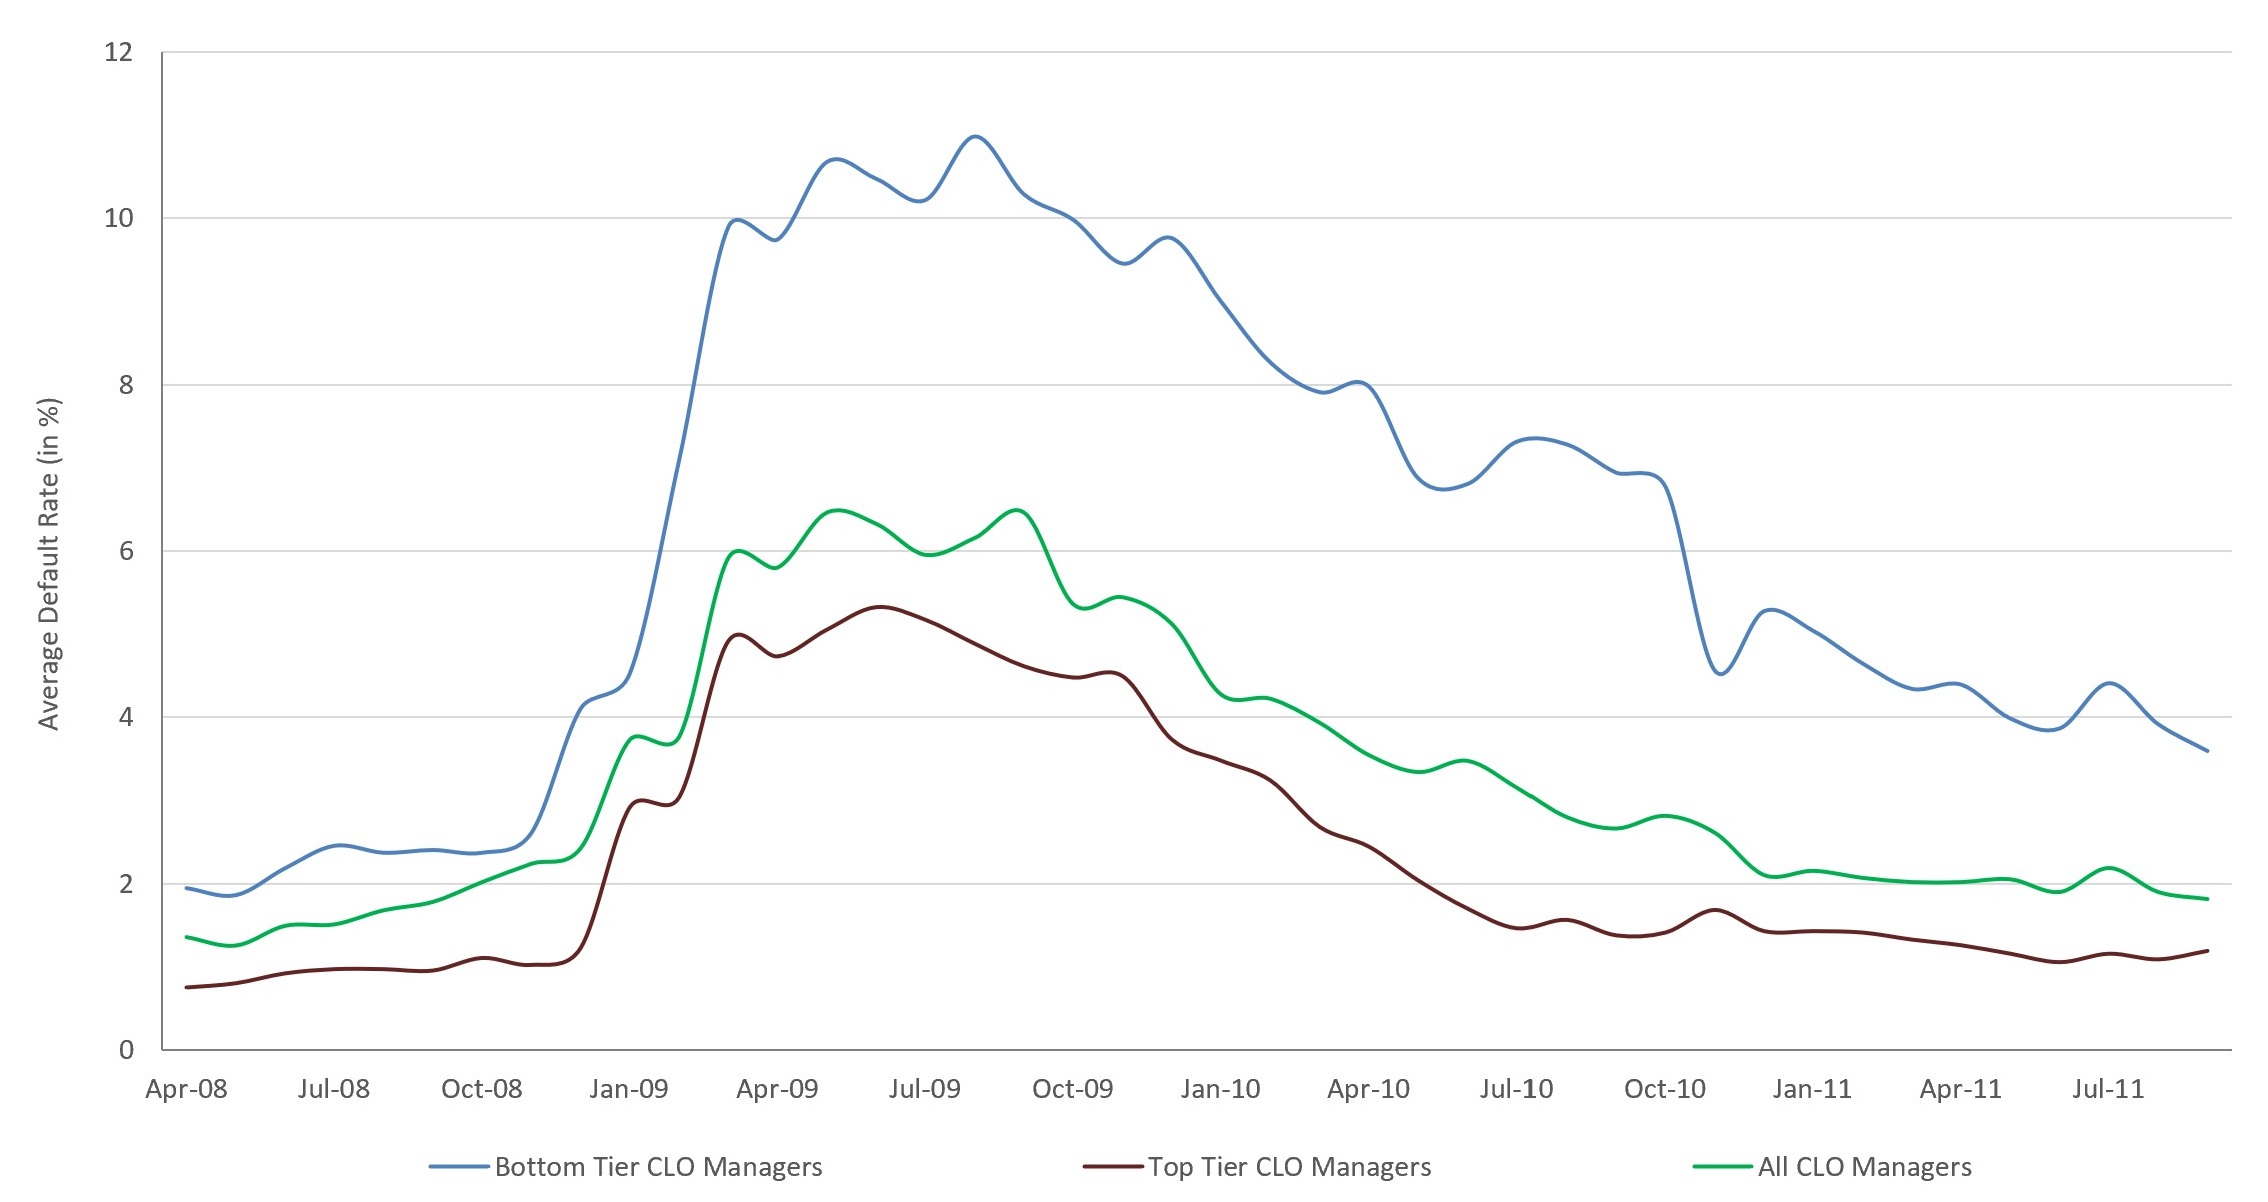
Default Rate of CLOs Managed by Top & Bottom Tier Managers*
Equity Cash-on-Cash Returns of Top & Bottom Tier Managers*
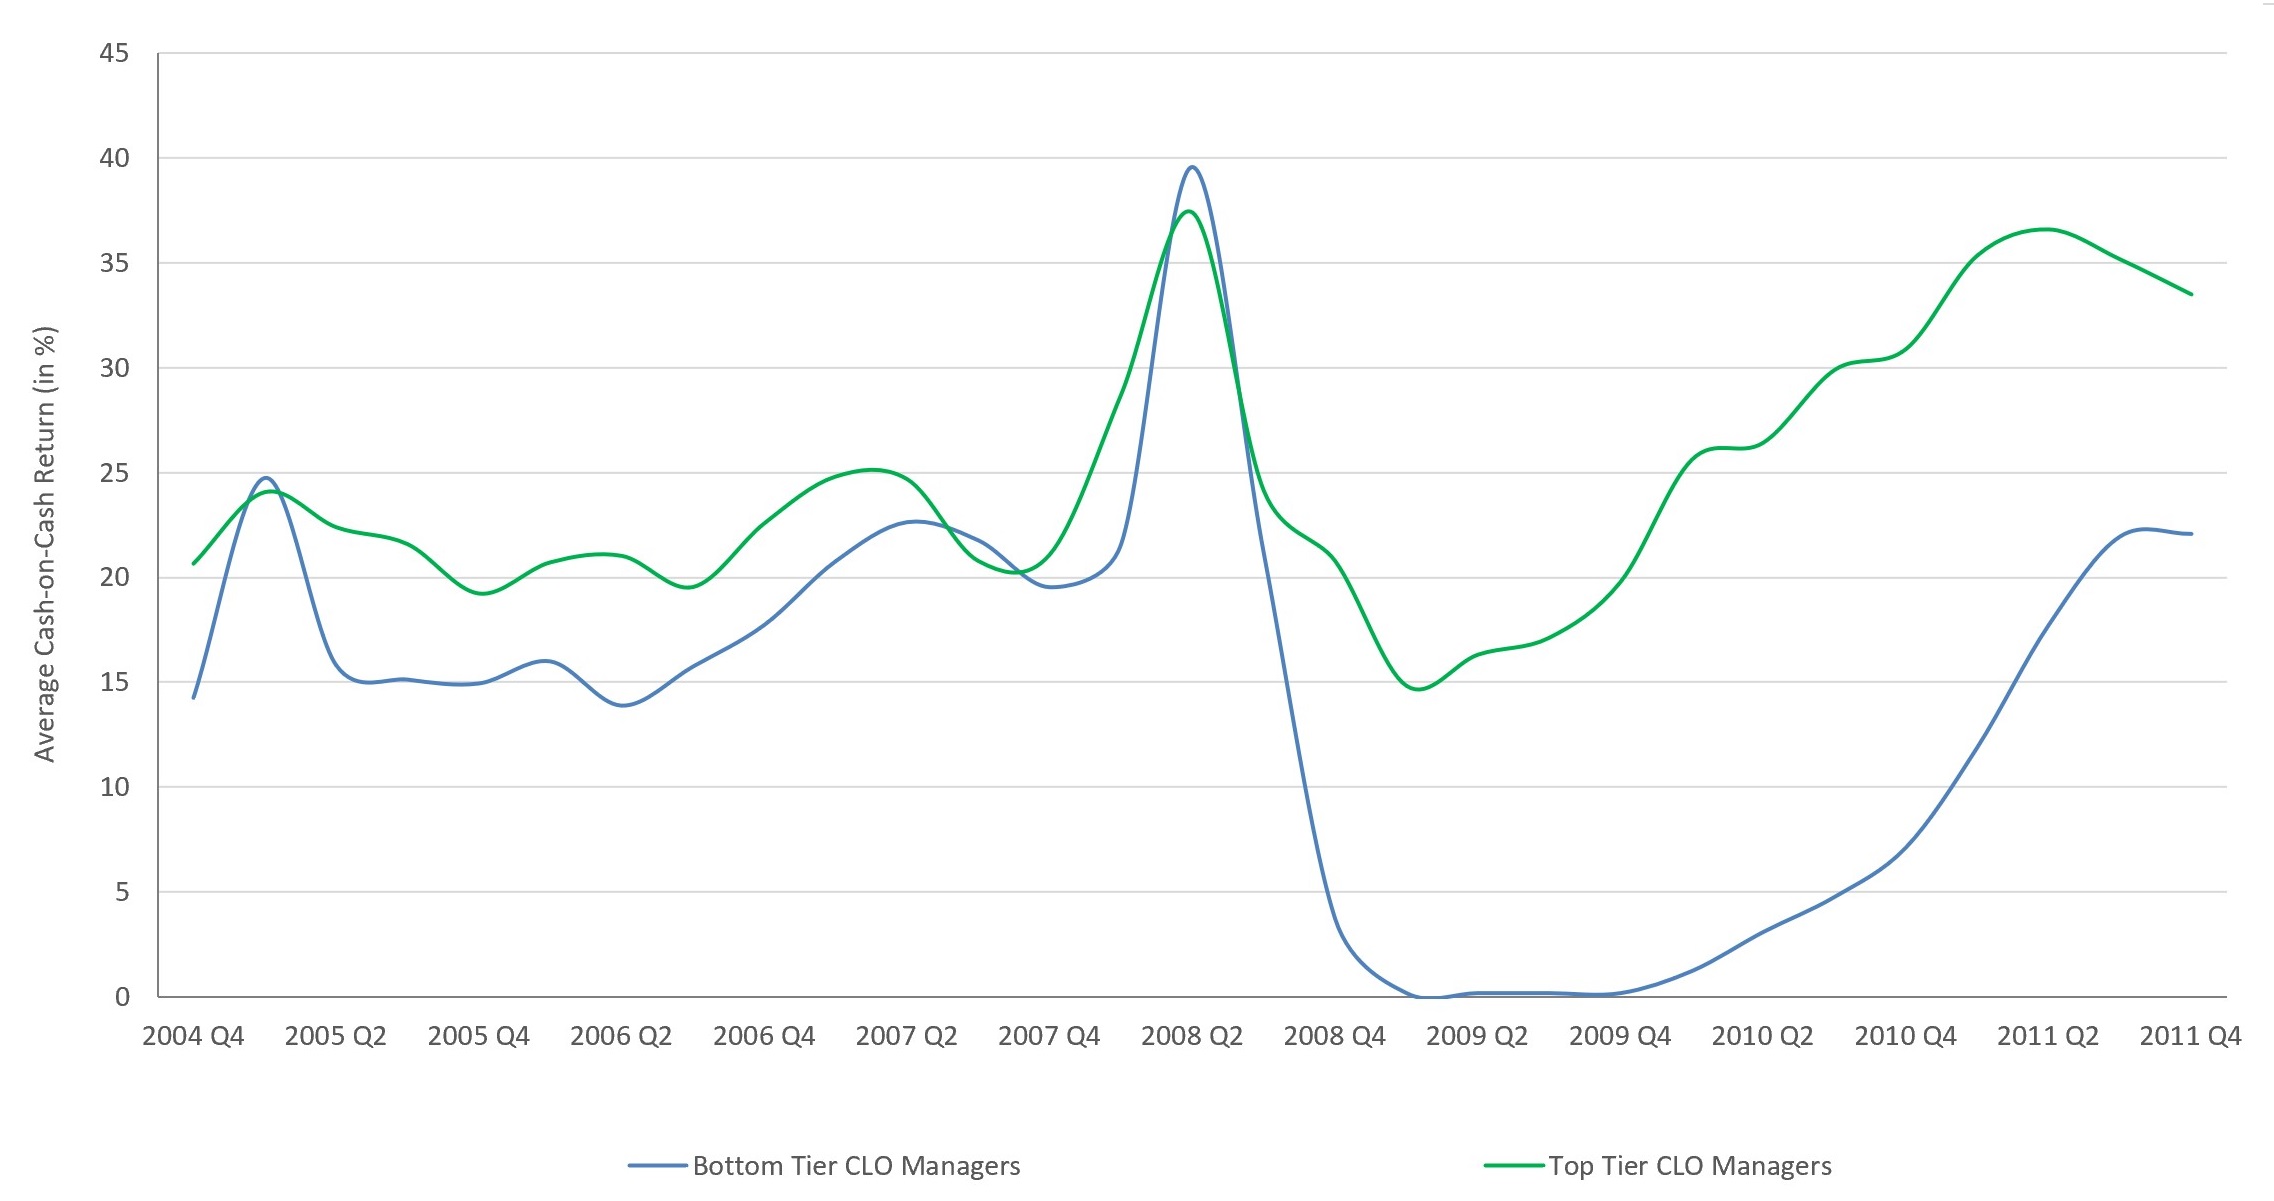
Source: Credit Suisse per September, 2011
*Market data of 480 CLOs from 134 managers. Positive past results / performance are no guarantee of future performance.
3 Risks
3.1 RISKS OF CLOS
Default Risk:
Every loan secured or unsecured carries default risk. Usually, secured loans have a higher recovery rate than unsecured bonds and, hence, tend to be more stable. However, there are industries, where even a secured loan does not give sufficient loss protection.
Liquidity Risk:
The lower the CLO tranche, the investor is invested in, the higher the illiquidity. Investing in the lower or lowest tranche may result in holding the tranche to maturity. It is also possible that market conditions and pricing of tranches may not reflect their real intrinsic value due to high illiquidity premia.
Currency Risk:
European investors face currency risk if they happen to invest in U.S. Dollar denominated CLOs.
Event Risk:
Unpredictable risks called „black swans" cannot be foreseen, calculated or hedged. An example for such a risk is 9/11 (World Trade Center attack), which sent the markets into turmoil.
Personnel Risk:
Entering a CLO position the investor purchases the ability of the management to run the portfolio according to their track record as well as the experience of the CLO manager team. Consequently, a change in the key personnel of the CLO manager might result in a significant change of the risk profile.
Human Error:
Human error may occur in multiple ways. Examples are buying instead of selling or vice versa, mistakenly selling the portfolio or parts of it or booking an erroneous transaction.
Fraud:
Fraud is very difficult to detect. The securitized credits of the investment portfolio are subject to fraud risks. These may occur on the part of both the obligor and the CLO manager.
3.2 DEFAULT HISTORY OF CLOS
According to S&P Global Ratings, from 1994 to 2019 only 0.4% of CLOs rated by S&P defaulted, i.e. of the 13,430 CLO tranches rated by S&P since 1994, 58 CLO tranches defaulted. Drivers for the losses were positions in subordinated corporate bonds with fixed coupons that suffered large losses in the years from 2000 to 2002. Moreover, the discrepancy between an exposure of 15% to 30% to fixed rate assets on the CLO asset side versus a floating rate CLO liability side, deteriorated the situation further in the rising interest rate environment.
Those factors have been largely eliminated in today's CLO structures. Since 2013, it is rare for a CLO to be permitted to hold any bond positions (in some structures there is still some flexibility to buy corporate bonds but this is limited to between 5% and 7%). Furthermore, any fixed rate exposure within a CLO is hedged to protect against movement in interest rates.
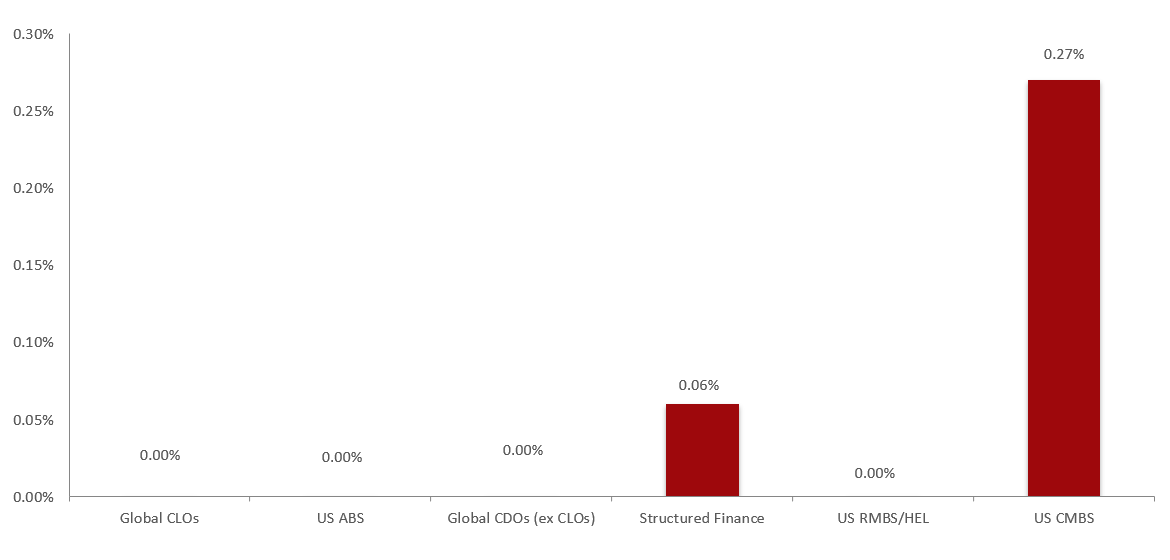
Five-Year Loss Rate for the Time Horizon Ending 2022 Q3
Source: Moody's Investors Service
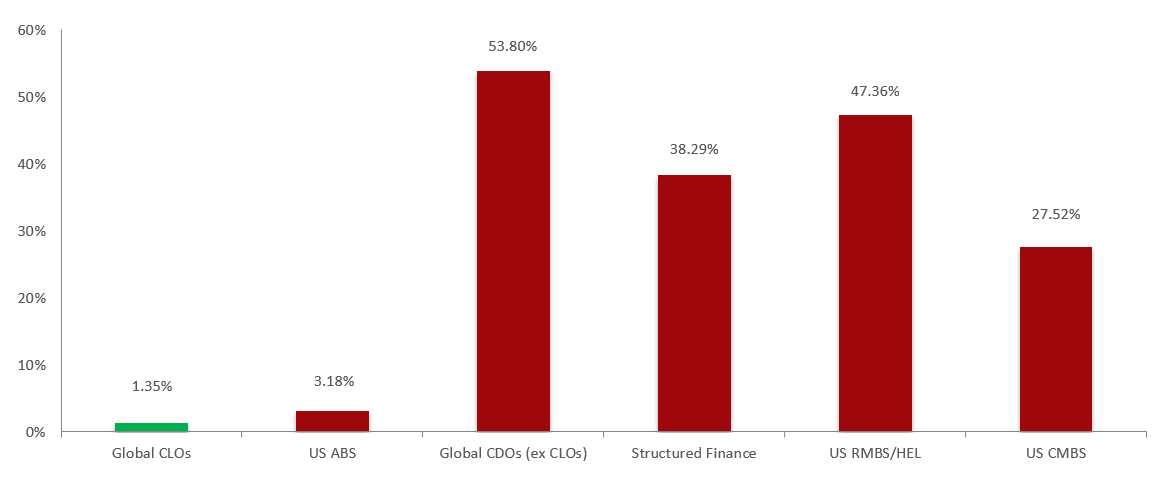
Historical Cumulated Loss Rates (Jul. 2008 – Jun. 2013)
Source: Moody's Investors Service
3.3 HISTORY OF RISK PREMIA
Risk premia are defined as the spread between a “riskless" investment and a risky investment. From the beginning to the peak of the Great Financial Crisis (2007 - 2009), the risk premium increased significantly in all CLO tranches. This clearly illustrates the liquidity bottleneck and the aversion of investors and traders to take any kind of risk.
U.S. 1.0 BSL CLO Spreads
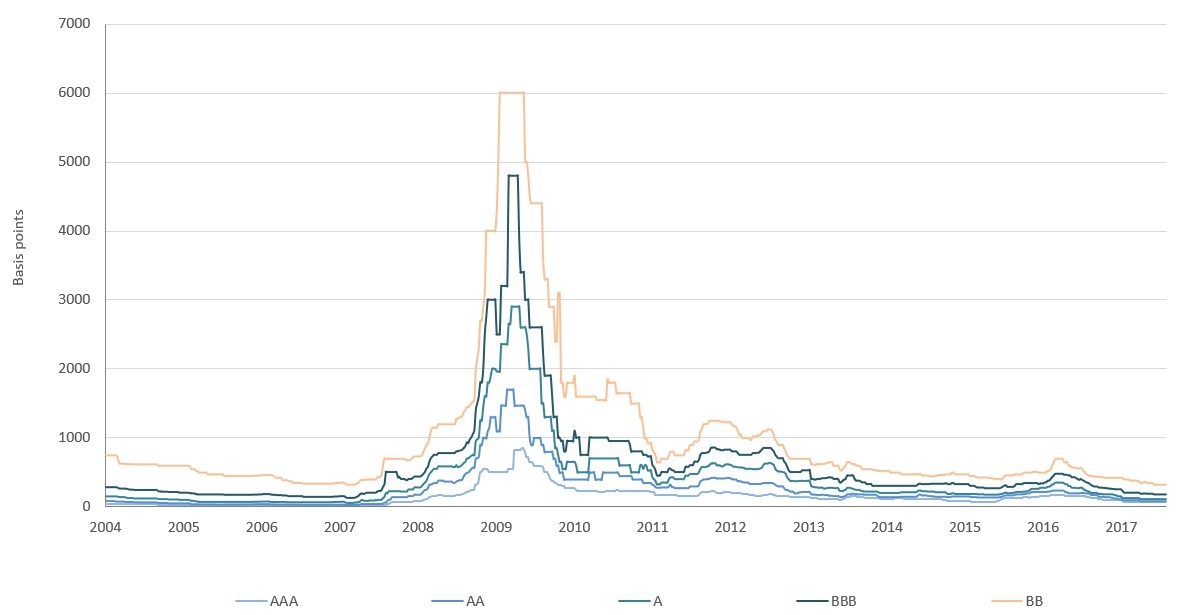
Source: Wells Fargo; data as per July 2017
U.S. 2.0 BSL CLO Primary Spreads
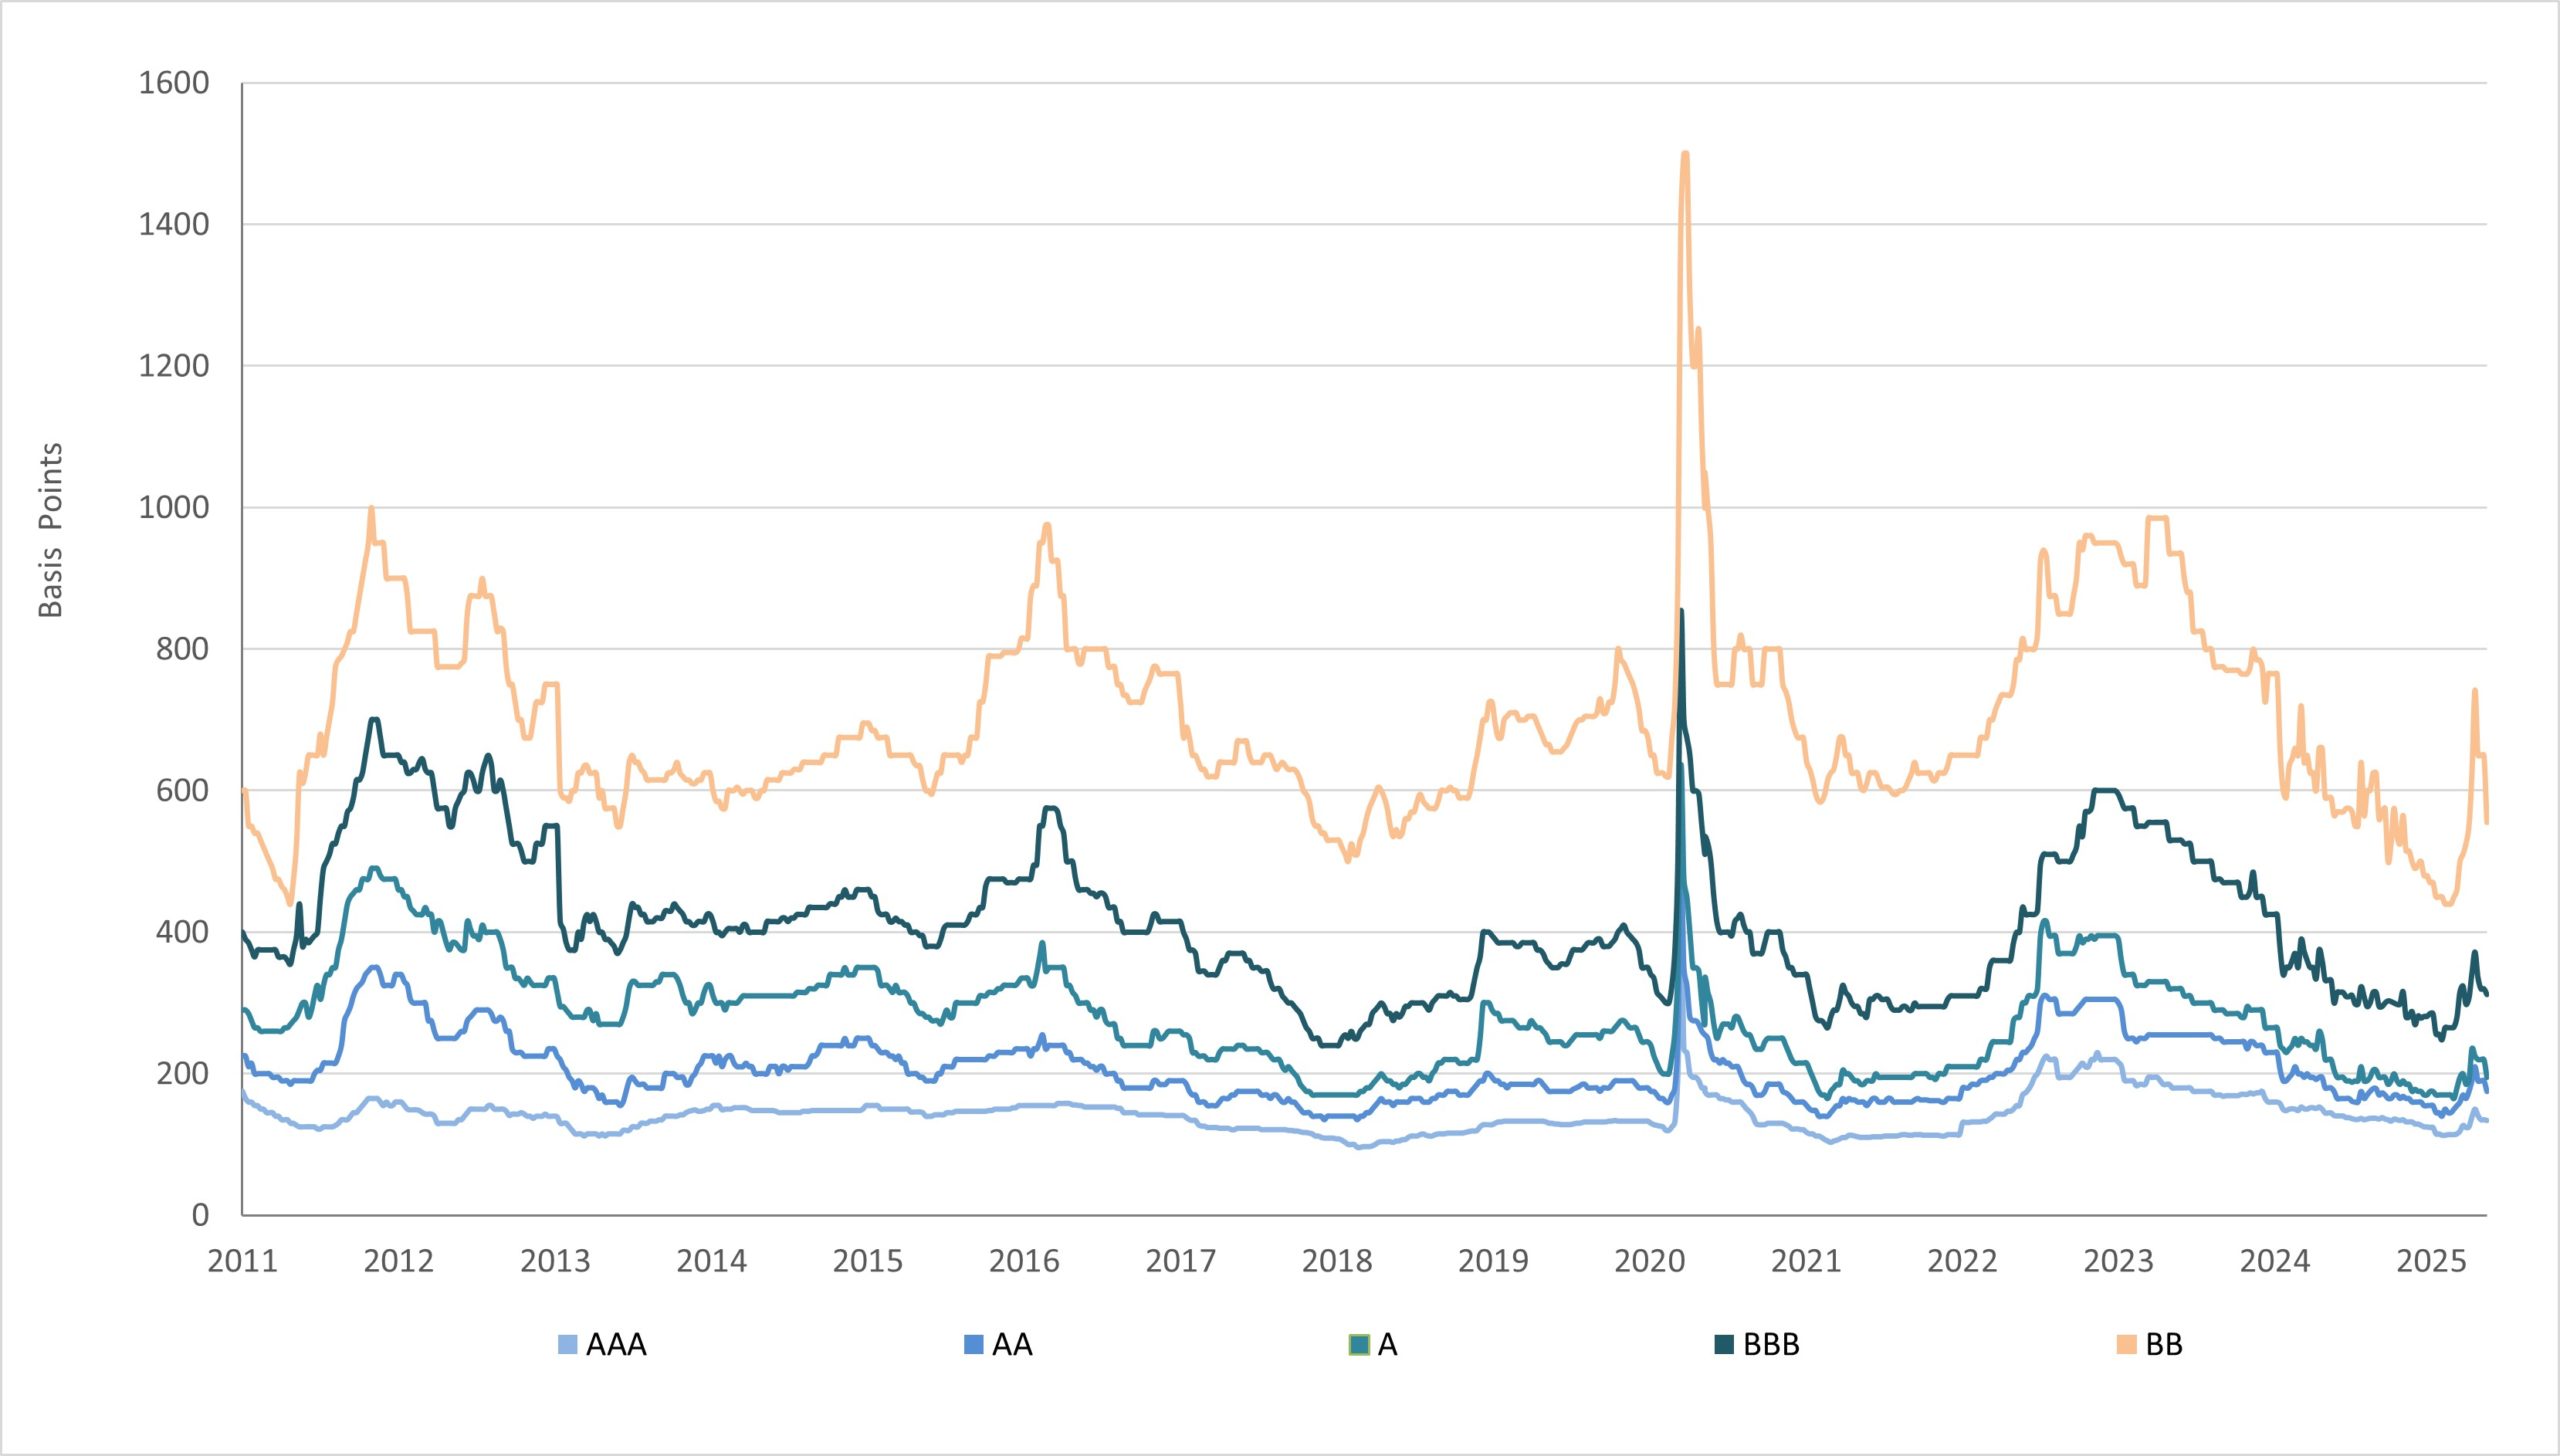
Source: BofA Research; data as per May 2025
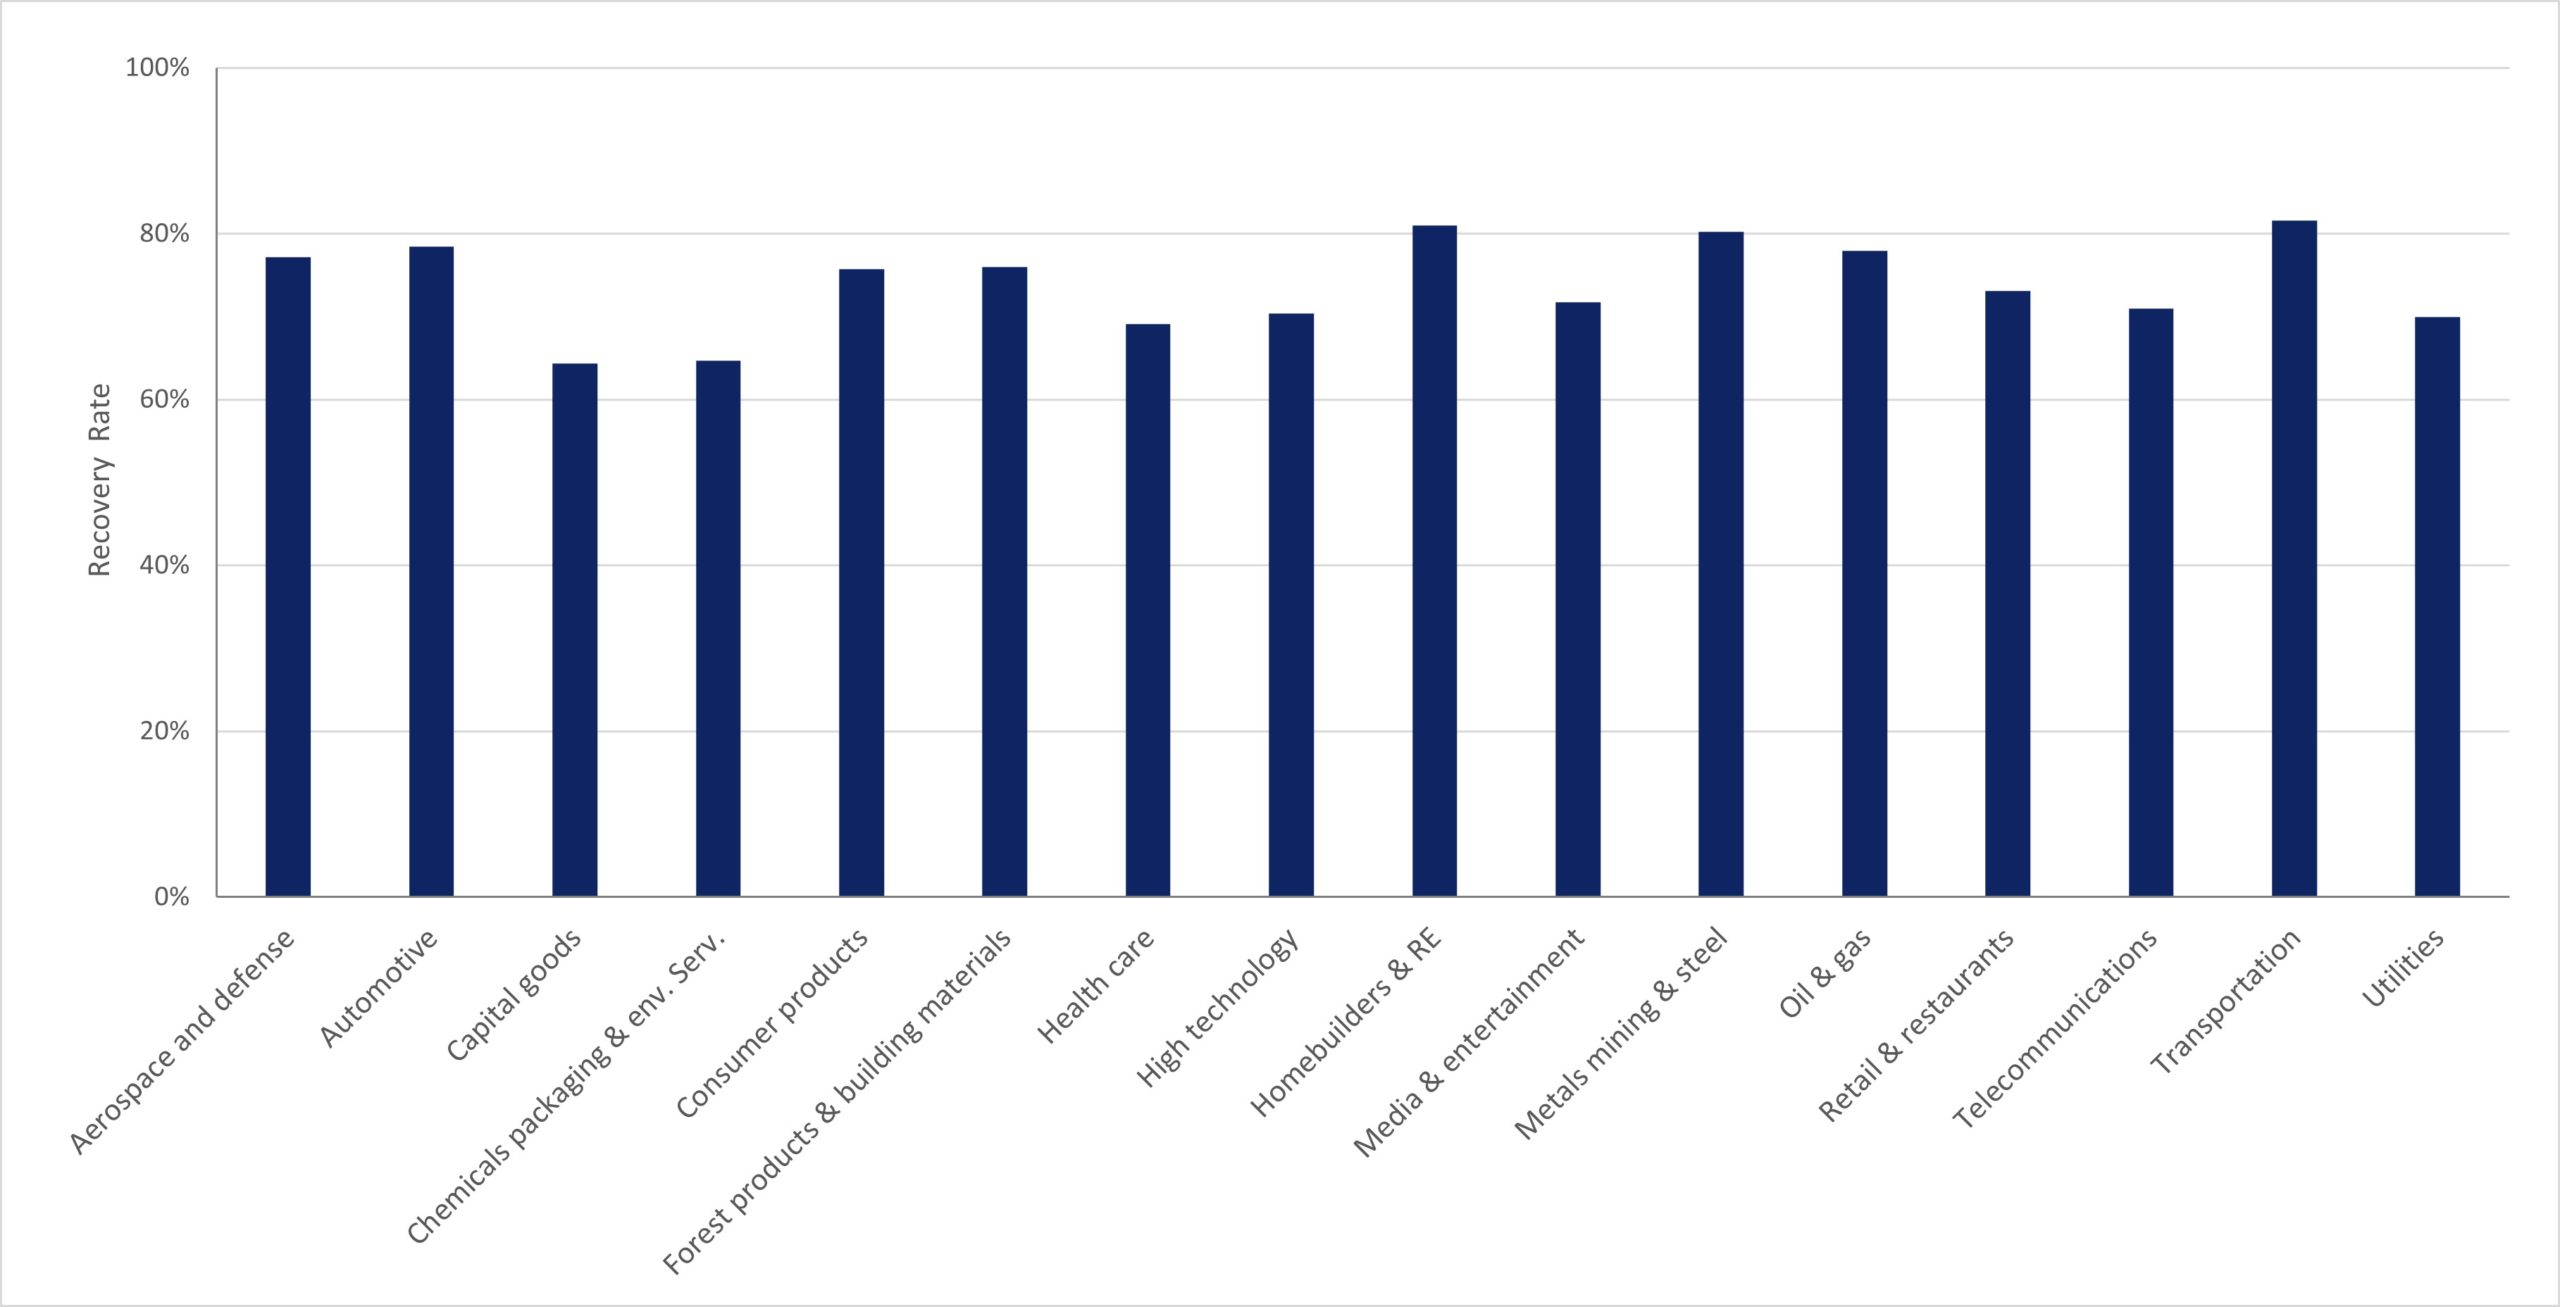
3.4 RECOVERY RATES BY INDUSTRY GROUP
Source: S&P Data through 1987 - Sep. 2023; includes loans that defaulted from US issuers;
3.5 DEFAULT RATES OF SUB-INVESTMENT GRADE COMPANIES ACCORDING TO MOODY’S
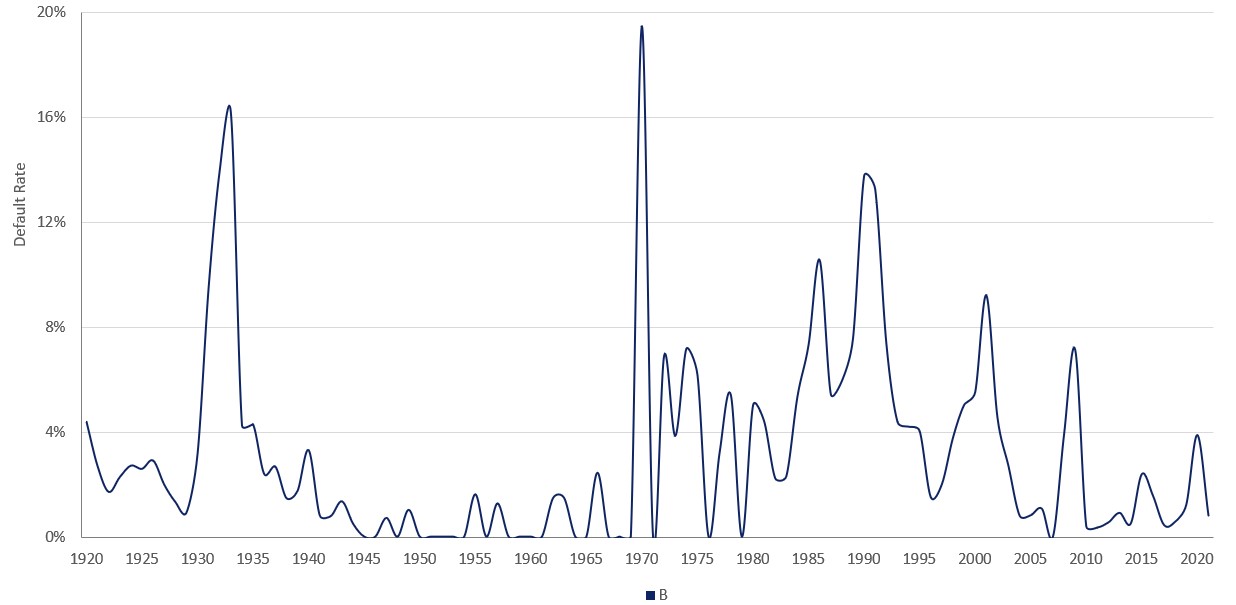
Source: Moody's Investors Service
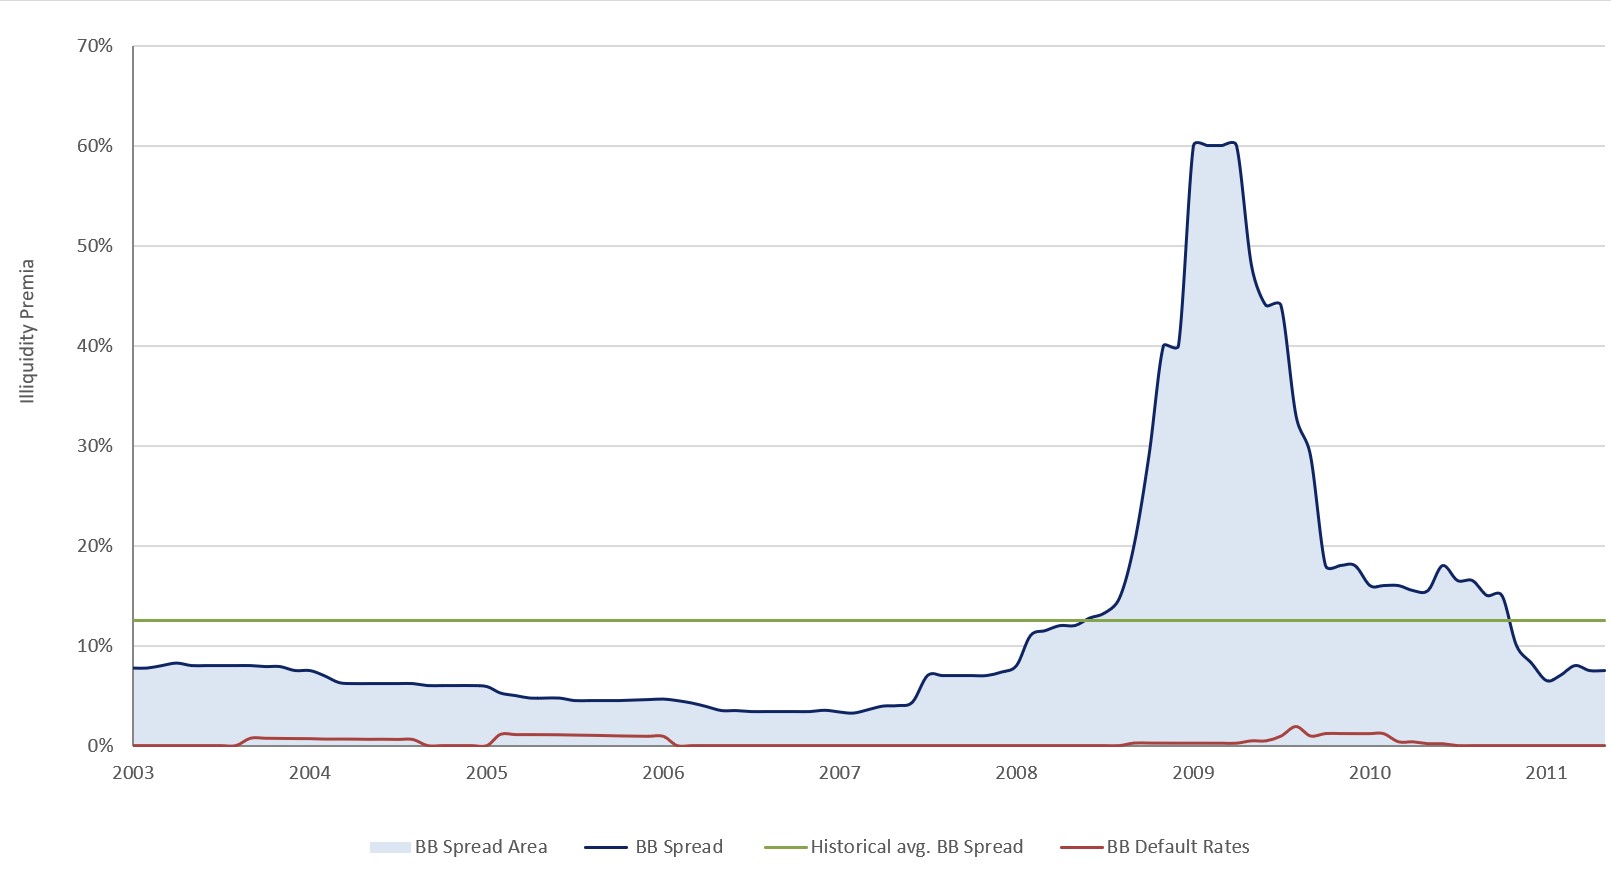
3.6 ILLIQUIDITY PREMIA
The historical average risk premia imply a higher default rate than actually occurred. Default rates depict just one factor of the risk premia consisting among other things out of illiquidity, rating etc. This is shown in the charts below. Currently, the highest risk premia are earned by intentionally taking an illiquid position.
Before and During the Great Financial Crisis
After the Great Financial Crisis
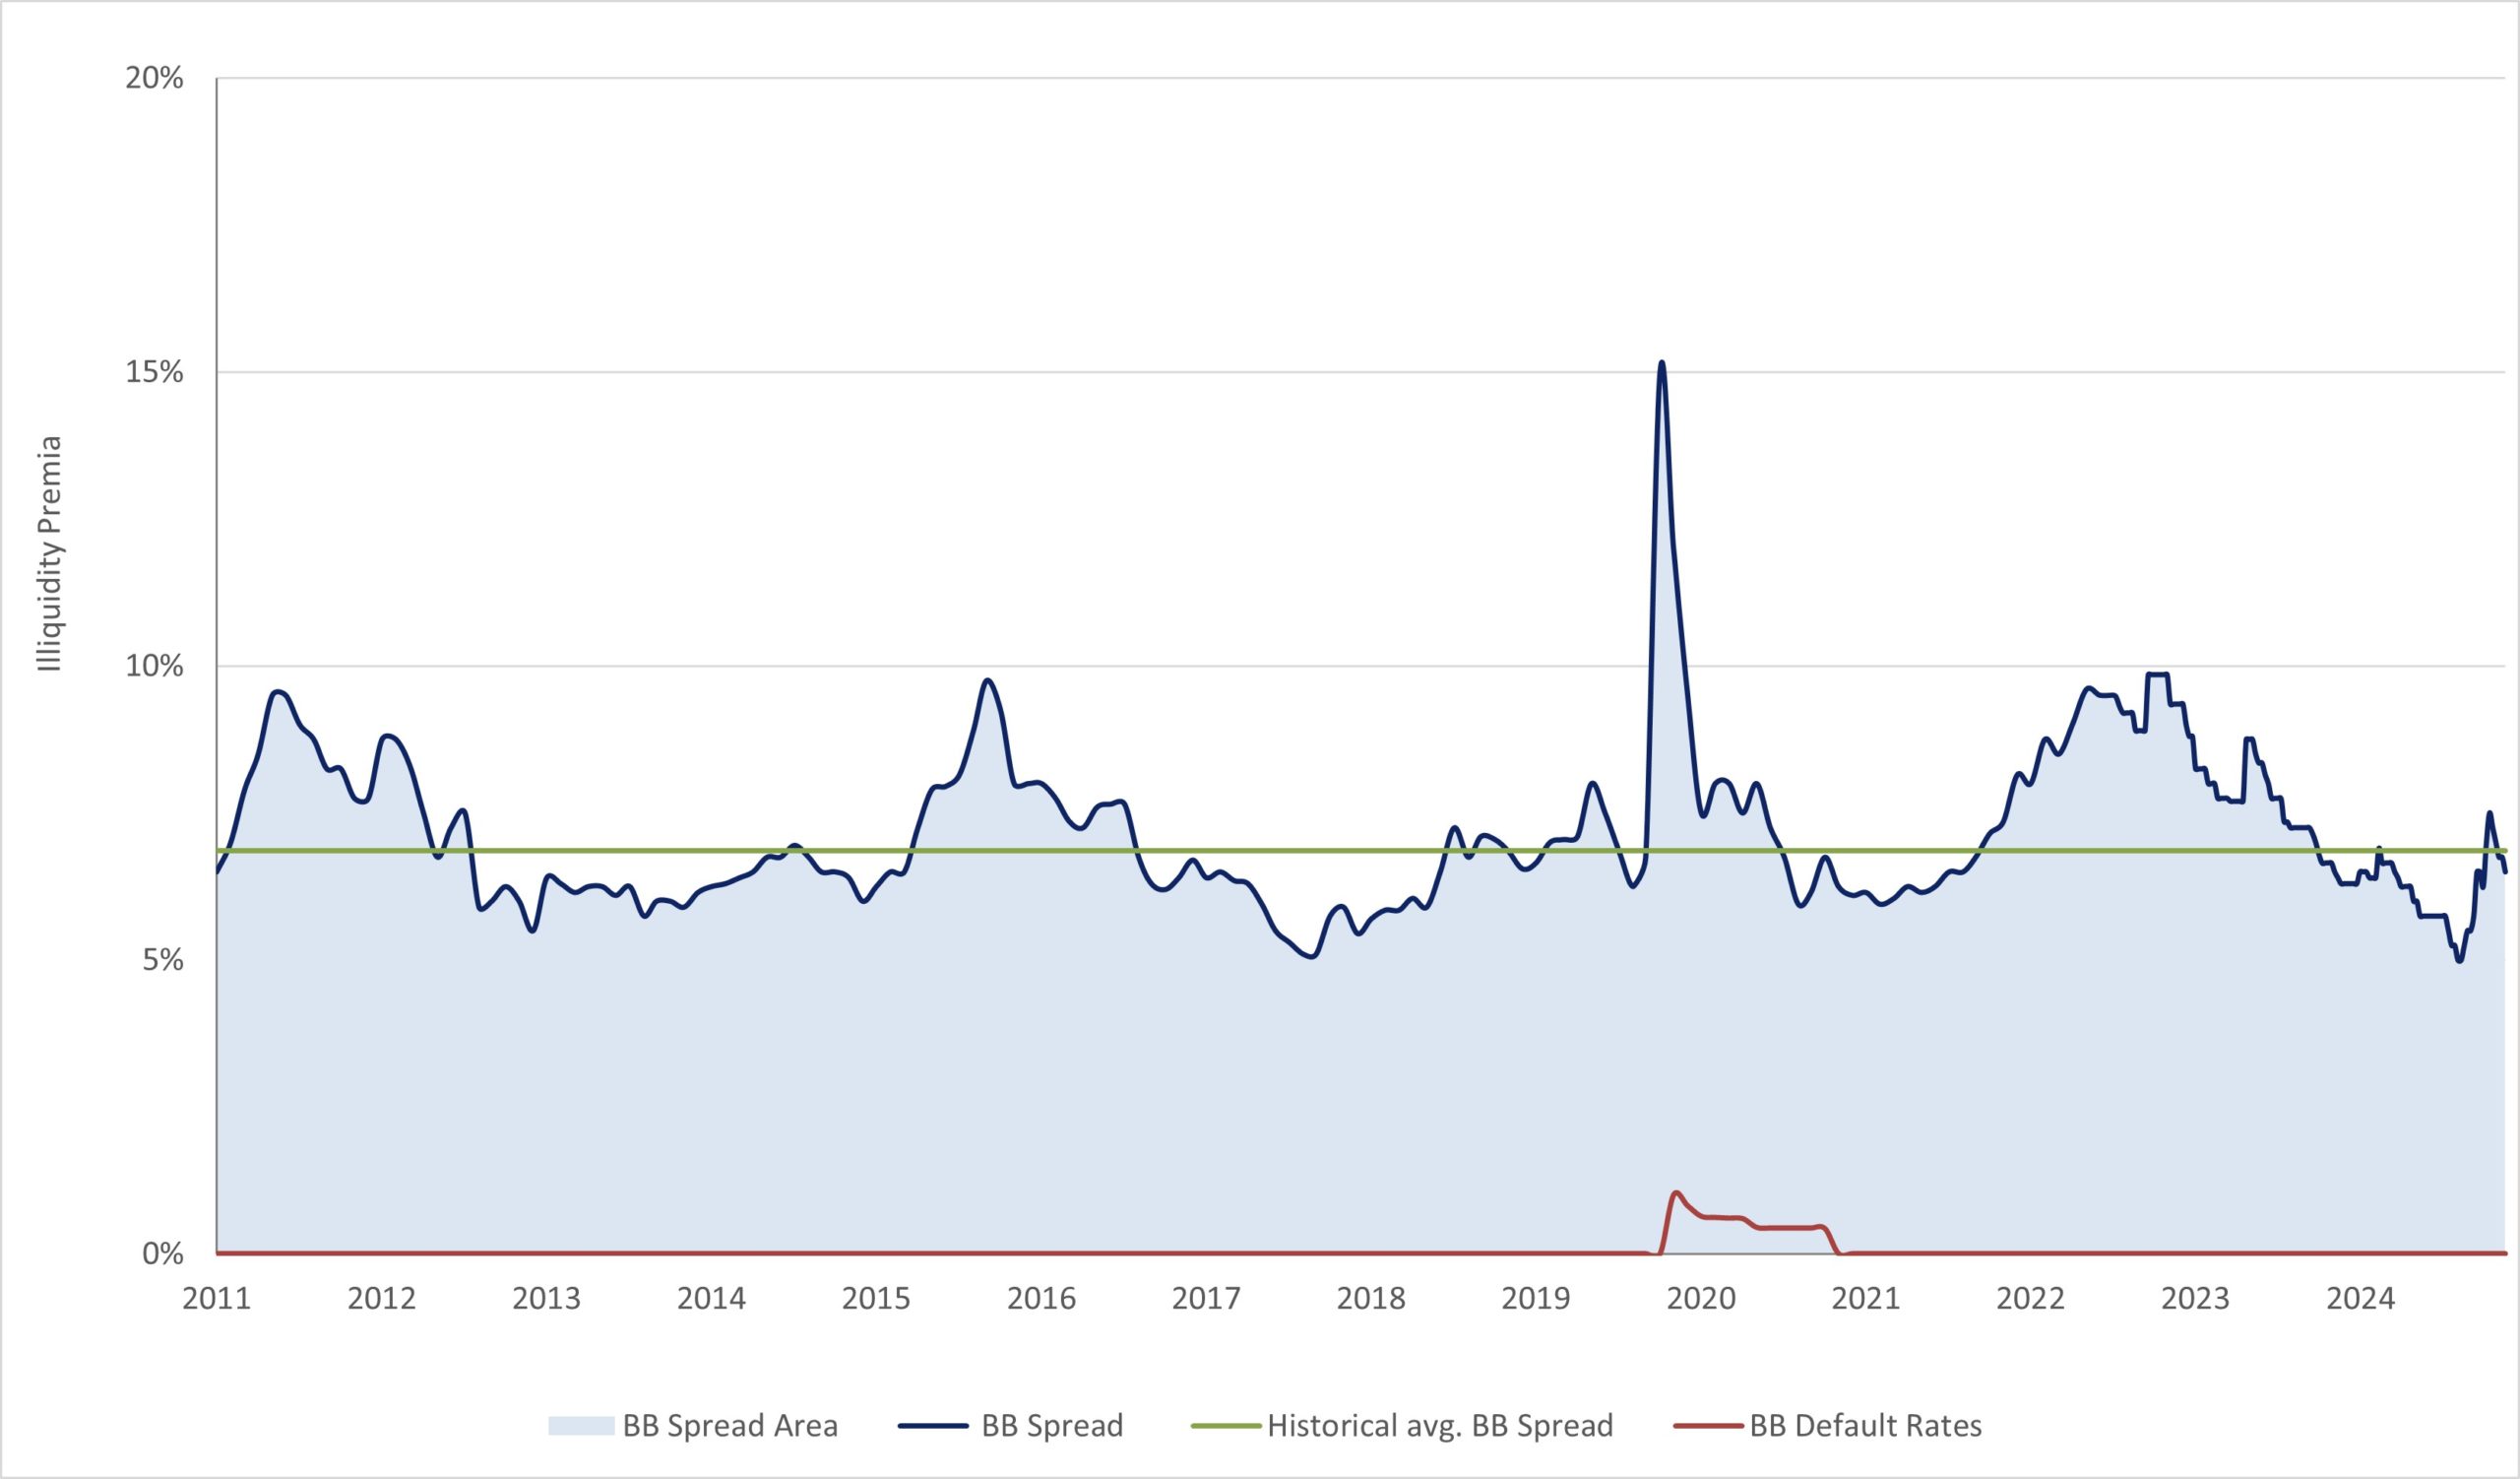
Source: Wells Fargo, Moody's
4 Miscellaneous
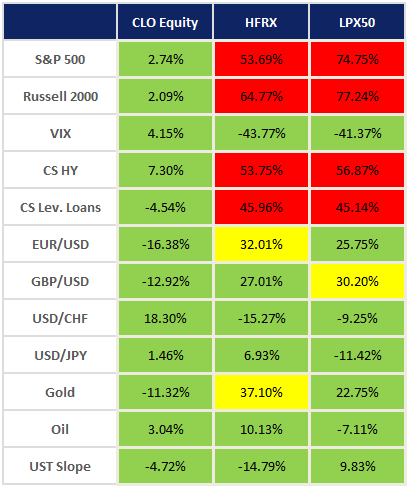
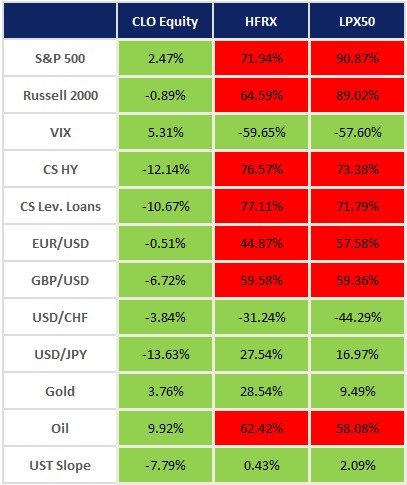
4.1 CORRELATIONS AND DECORRELATIONS
In order to clarify the correlations, we are showing three different timelines:
2002-2007 (Before the Great Financial Crisis)
2007-2012 (During the Great Financial Crisis)
2012-2019 (After the Great Financial Crisis)
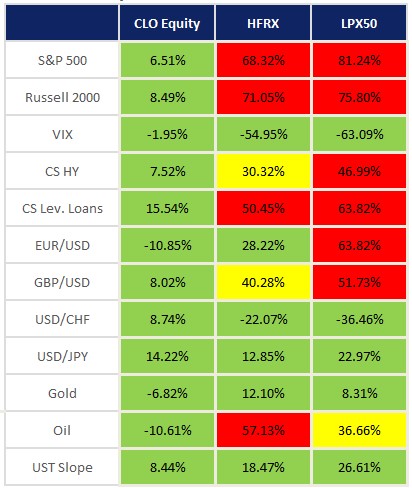
2020-2024 (During and After the COVID Crisis)
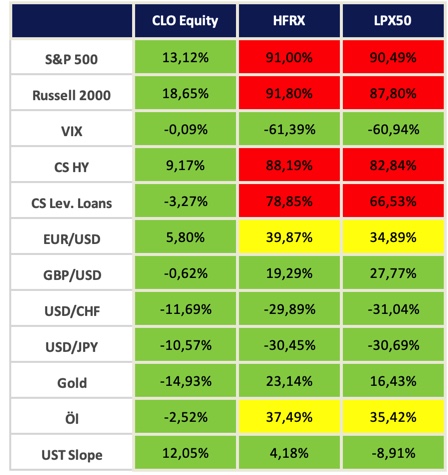
[1] The HFRX Global Hedge Fund Index is designed to be representative of the overall composition of the hedge fund universe. It is comprised of all eligible hedge fund strategies; including but not limited to convertible arbitrage, distressed securities, equity hedge, equity market neutral, event driven, macro, merger arbitrage, and relative value arbitrage. The strategies are asset weighted based on the distribution of assets in the hedge fund industry.
[2] The LPX50 is a global index that consists of the 50 largest liquid LPE companies covered by LPX.
4.2 PREJUDICE AGAINST CLOS
“CLOs caused the crisis.”
CLO securities are cash only instrument with no derivatives or leverage. They were one of the earlier asset classes to recover after the crisis because they have downside protection via liens and covenants as well as senior status in issuers' capital structures.
(SPBDLL Index)
“CLOs are highly illiquid.”
CLOs trade actively in the secondary market mainly through banks and brokers. As an example: one form of execution is known as BWIC (bids-wanted-in competition) which had a turnover of around $74 bn in 2022.
(Citi Velocity)
“CLOs suffer from high default rates.”
Global CLO loss given default rate (LGD) is very low: for the cumulative 5-year period including the Great Financial Crisis (mid - 2008 to mid - 2013) the LGD for all CLOs accounts only for 1.35%. While after the Great Financial Crisis the loss rate was even lower at 0.00% (five-year loss rate-for the time horizon ending 2022 Q3).
(Moody’s Default Study)
“CLOs are structured products that have no real market value.”
The collateral held in CLOs are portfolios of sub investment grade corporate loans. These loans are less expensive and more efficient to administer than traditional bilateral or individual credit lines. In today's low rates and slow growth environment, CLOs offer investors a unique diversification option due to their strong risk / return profile.
(CIS Research)
“CLOs are not transparent.”
CLOs differ from investments such as hedge funds as they provide very detailed reports to all investors. Generally, CLOs provide a report of their monthly activity (trustee reports) which also includes various structural tests conducted. Apart from this, CLOs also provide the indenture / contracts and payment reports based on the payment frequency.
(CIS Research)